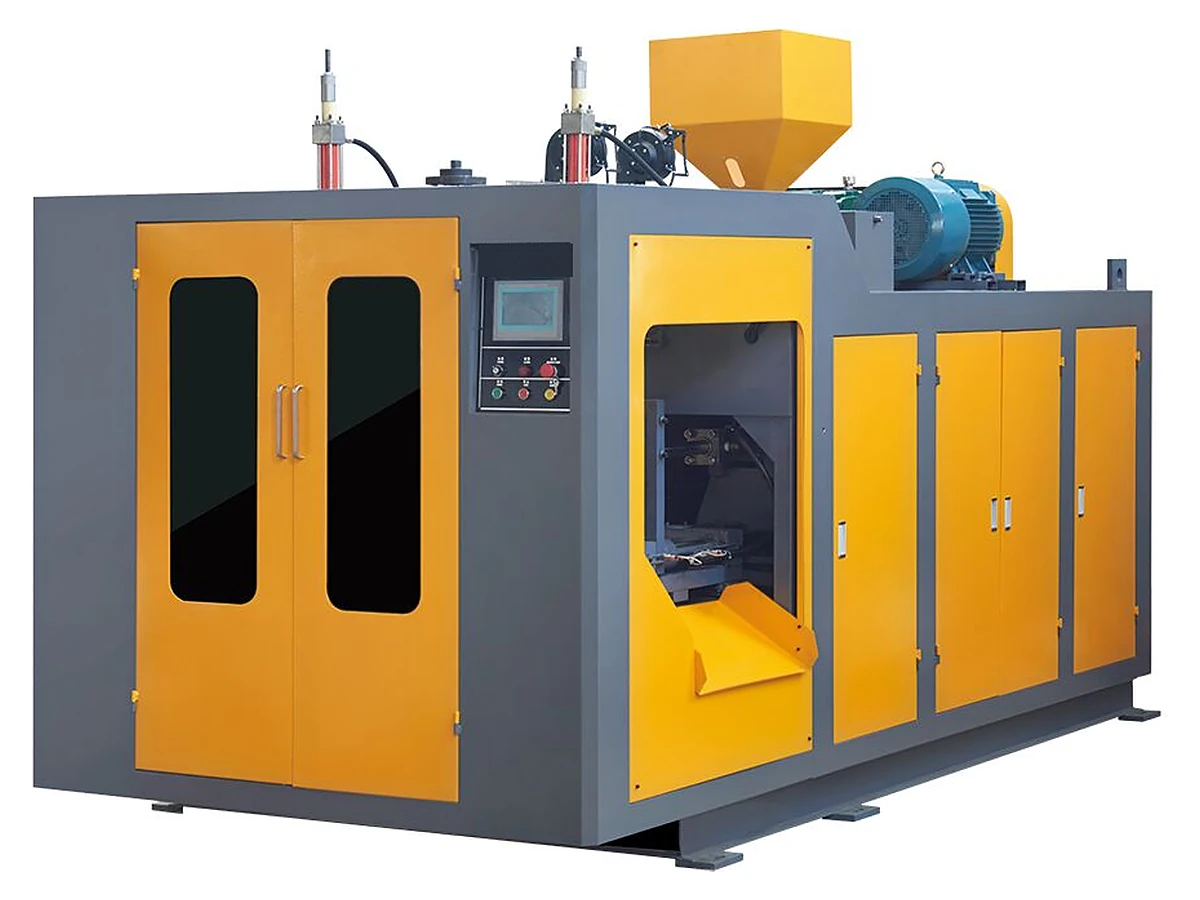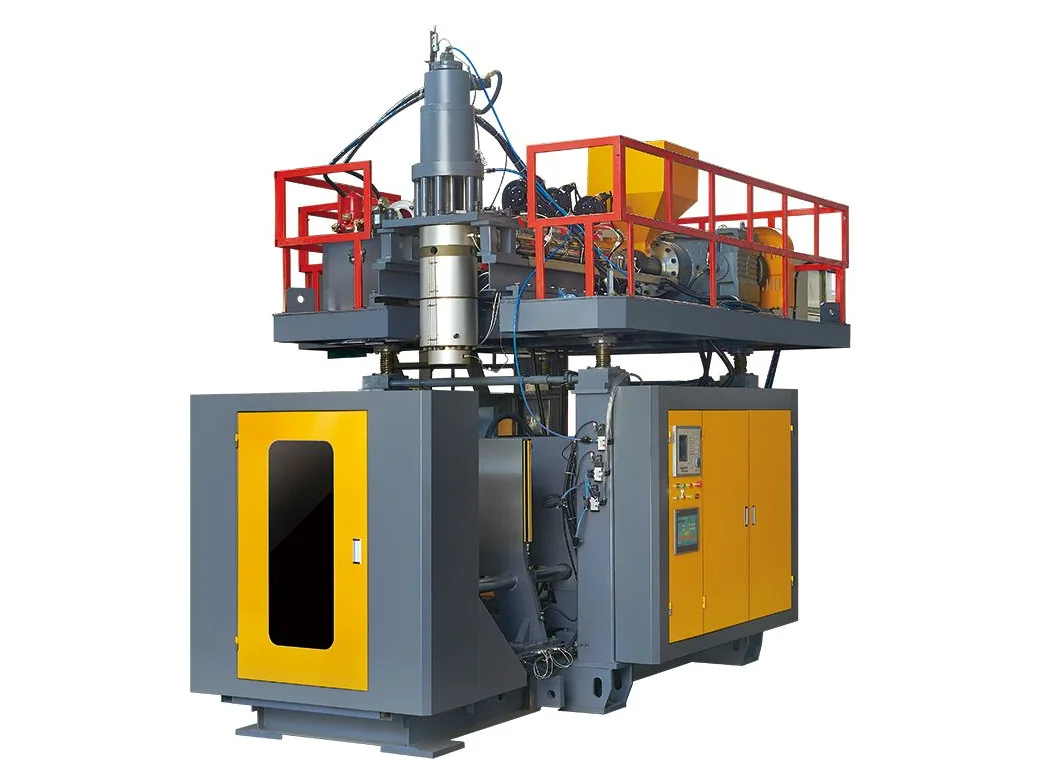
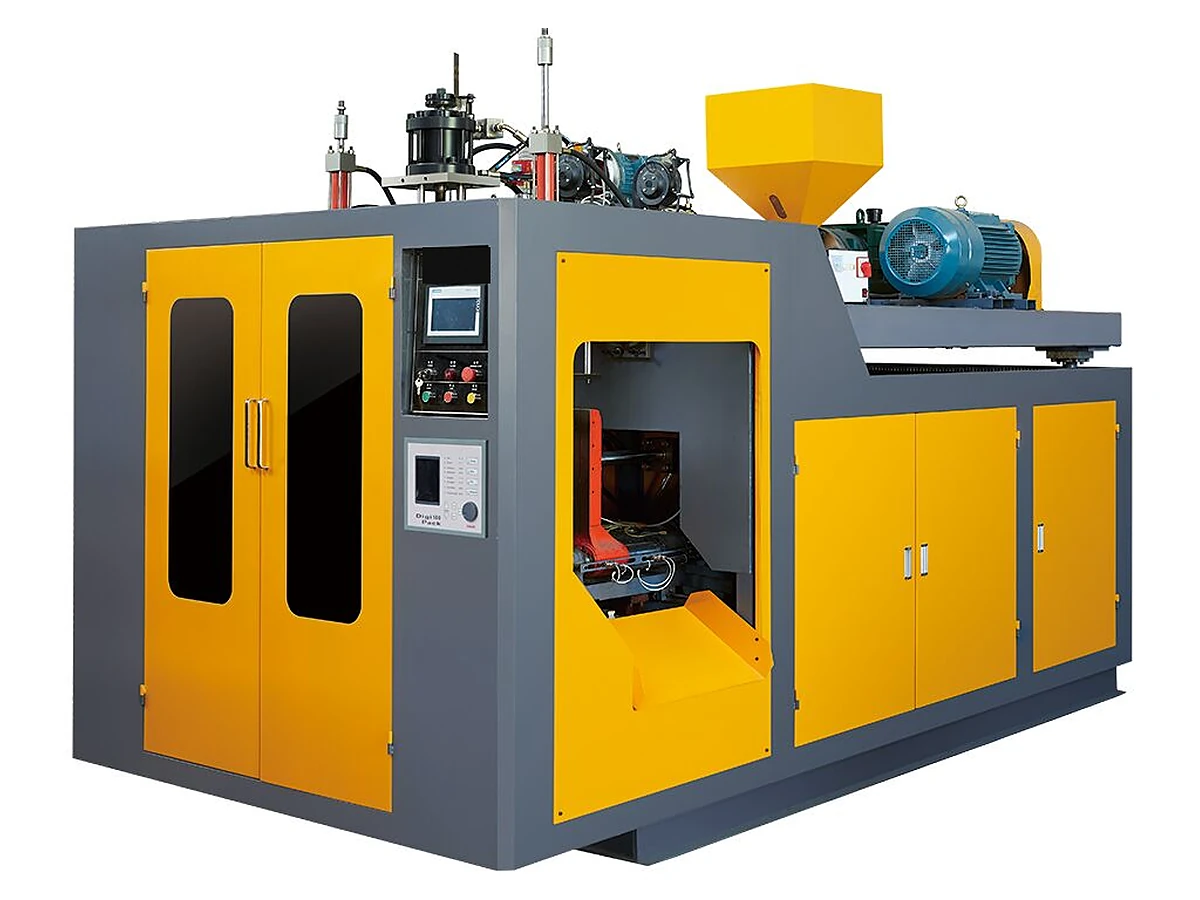
A 5 L blow molding machine may carry a 40 kW nameplate and still run at about 18 kW on the meter. Buyers who size the transformer from the nameplate pay for capacity they never use; buyers who estimate part cost from the running figure can miss the heat-up and peak load. Before you compare quotations, separate the two numbers: installed power is an electrical planning figure, and actual running power is a cost figure. Mixing them up is one of the most common mistakes in a container project budget.
The short answer: installed kW is not consumption
Installed power is the connected load for electrical planning: transformer, cable and breaker. Actual running power is what the meter records, and it is lower because heaters cycle and motors rarely hold rated load. For energy cost, use actual kW × running hours × tariff ÷ good parts, then confirm the figure on your own material and cycle.
Why the nameplate figure is higher than the meter
The installed figure adds every heater band, drive motor, control circuit and auxiliary circuit at rated load. That is the load the supply must carry during heat-up and at peak demand, so it is the right number for electrical design. In steady production the load is smaller: barrel heaters only replace heat losses once the zones are at temperature, the main motor's draw changes through the cycle, and clamp, blow and cooling do not peak together. The gap varies by model, drive type and process settings, so do not apply a fixed percentage.
- Material and melt temperature: a higher melt temperature asks more from the barrel heaters; use the process sheet for your own resin.
- Drive type: hydraulic and servo drives have different load profiles; confirm the configuration offered before you fix the model, and compare the drive options first.
- Cycle and cooling: cooling time changes output, and output is the divisor in the cost per part; use a measured cycle, not a nominal figure.
- Auxiliaries: chiller, air compressor, grinder and conveyor are separate loads; add them to the plant budget.
- Maintenance: dirty heater bands, damaged insulation and screw wear all change the current draw; check them at commissioning.
Power by model across the range
The table lists all ten models in the 0.1–50 L range. The installed column is for electrical planning; the actual column is a reference for energy estimates, not a measured reading from your line. Both figures are confirmed against the quotation, the material, the cycle and your local tariff. Within one container size, a double-station model shows a higher installed load and a higher reference actual load than the single-station version, because two clamps and two molds run on one base. Whether that raises or lowers energy per good part depends on output, so calculate it with your own cycle.
| Model | Container size | Installed power (kW) | Actual power, reference (kW) |
|---|---|---|---|
| ES-2LS | 2 L | 24–32 | 12–18 |
| ES-5LS | 5 L | 32–42 | 15–20 |
| ES-10LS | 10 L | 38–48 | 20–35 |
| ES-16LS | 16 L | 48–55 | 22–35 |
| ES-2LD | 2 L double-station | 26–35 | 18–26 |
| ES-5LD | 5 L double-station | 34–45 | 28–36 |
| ES-10LD | 10 L double-station | 45–55 | 38–46 |
| ES-16LD | 16 L double-station | 50–65 | 40–50 |
| ES-30L | 30 L | 100–110 | 30–40 |
| ES-50L | 50 L | 105–120 | 35–50 |
Swipe the table to see all columns →
What one good part costs in electricity
The formula is short: energy cost per good part = actual kW × running hours × tariff ÷ good parts produced in those hours. The two examples below use a tariff of USD 0.10/kWh and assumed part weights only to show the arithmetic; substitute your own electricity bill, part weight and measured good-part count.
5 L container on an ES-5LS: reference actual power is 15–20 kW. Over a 20-hour run at USD 0.10/kWh, electricity costs about USD 30–40. Output of 65–80 kg/h gives roughly 1,300–1,600 kg in that run, so energy works out at about USD 0.019–0.031 per kg of good output. At an assumed 150 g per container, that is roughly USD 0.003–0.005 per container.
20 L container on an ES-30L: reference actual power is 30–40 kW and output is 100–120 kg/h, which is about 0.25–0.40 kWh per kg. At the same tariff, energy costs about USD 0.025–0.040 per kg. At an assumed 1.1 kg per container, the electricity is roughly USD 0.028–0.044 per container.
Read these as illustrations, not quotations. The tariff, part weight, good-part rate and measured cycle all move the result, and the reference kW must be confirmed against the quotation and a meter reading. Electricity is usually a small share of a container's total cost, but the connected load is a capital item: an undersized transformer or cable is expensive to correct after installation. If your tariff includes a demand charge, plan it from the installed figure. Ask for the reference figure for the exact model and configuration quoted, not a series average.
Compare the published power figures on thesingle-station 0.1–16 L rangeand thedouble-station 0.1–16 L range, then send your container drawing and local tariff for a quotation.
What to send for a quotation
- Container drawing: volume, weight, wall thickness, neck finish and handle; a sample helps.
- Material and layer structure: PE, PP, HDPE, HDPP, PC, PVC, PETG or EVOH multi-layer, subject to available configurations; confirm the exact list for the model quoted.
- Cavity count and target output: good parts per hour or per shift, plus the shift pattern.
- Plant power supply: voltage, frequency and phases, and whether a transformer or generator is part of the supply.
- Local tariff: currency per kWh, peak and off-peak periods, and any demand charge.
- Auxiliaries: chiller, air compressor, grinder and conveyor, and whether they are in the supplier's scope.
- Destination: country and port, because the electrical configuration is confirmed per order and destination.
Source: E-SHION product data. Specifications are subject to change without notice; customization is available.
This guide is written for production and procurement decisions. It uses published figures where available and avoids unverified performance claims.